Market Research
The Burger Lab is situated at a location that is easily accessible by customer which is Northbridge. Northbridge is one of centre of attraction in Perth and it is a popular spot for tourist and locals to hang
around with their families and friends. Therefore, our target market is people who live in a suburb that
is near to the city and Northbridge.
To further define the target market, data collected by the Australian Bureau of Statistics (ABS)
regarding population and household income allowed us to make informed decisions as to which
demographic profile in this region would be most profitable.
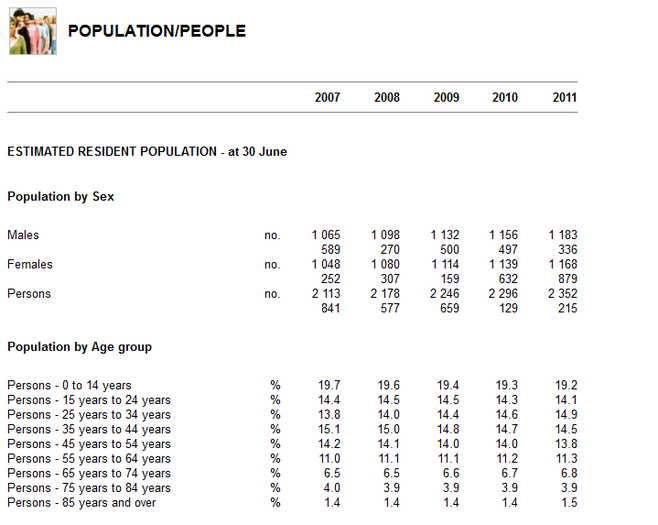 Figure 1
Figure 1
(Austalian Bureau of Statistics, 2013)
(Austalian Bureau of Statistics, 2013)
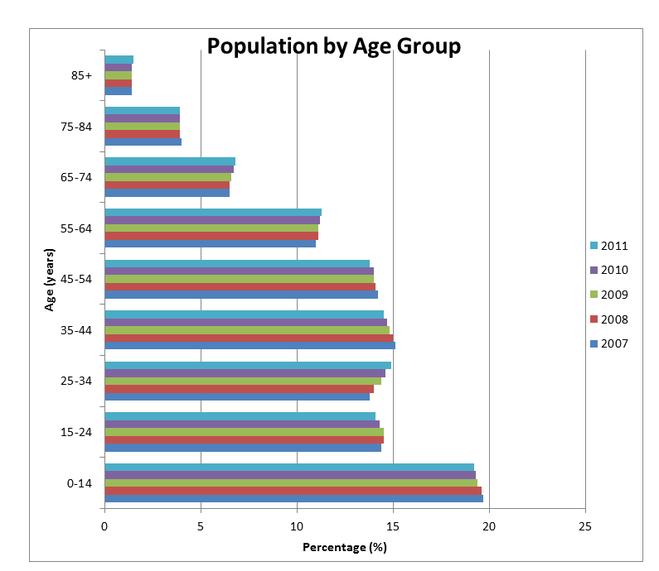
Figure 2
|
2007
Mean =11.2 % Standard Deviation =5.61% |
2008
Mean = 11.2% Standard deviation =5.61% |
2009
Mean = 11.12% Standard deviation = 5.57% |
2010
Mean = 11.2% Standard deviation = 5.54% |
2011
Mean = 11.11% Standard deviation = 5.48% |
The above chart shows the population by age group in Western Australia. We can see that the
majority of the population range from age 0-14. As we have mentioned that the business will be targeted
towards teenagers and kids because they tend to fancy burgers more compared to a person who age from
55 and over. By looking at the mean and standard deviation, it shows that the data are clustered closely
around the mean which makes it more reliably.
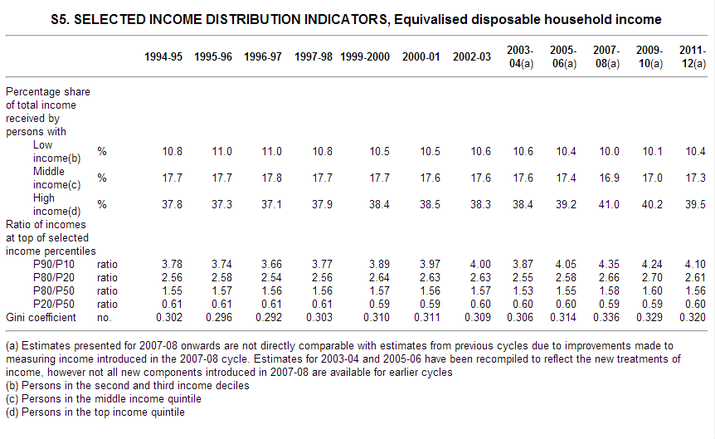
Figure 3
(Australian Bureau of Statistics, 2012)
(Australian Bureau of Statistics, 2012)
|
Low income
Mean = 10.56% Standard deviation= 0.30% |
Middle Income
Mean =17.5% Standard deviation =0.28% |
High income
Mean = 38.63% Standard deviation = 1.11% |
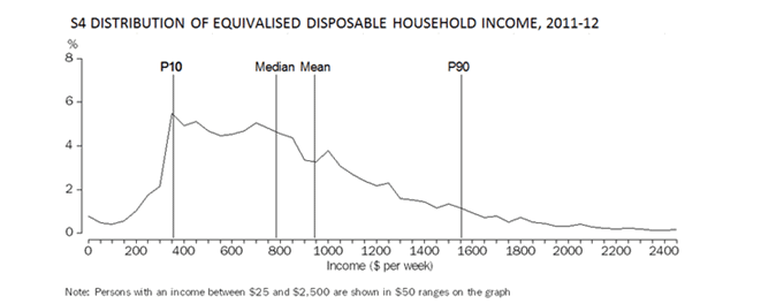
Figure 4
(Australian Bureau of Statistics, 2013)
(Australian Bureau of Statistics, 2013)
While the mean equivalised disposable household income of all households in Western Australia
in 2011-12 was $918 per week, the median (i.e. the midpoint when all people are ranked in ascending order
of income) was somewhat lower at $790. This difference reflects the typically asymmetric distribution
of income where a relatively small number of people have relatively very high household incomes, and
a large number of people have relatively lower household incomes, as illustrated in the following
frequency distribution graph.
